
“For an issue of this scale, cooperation is our best asset,”
–Scholar Claire Hiaasen, Broward County
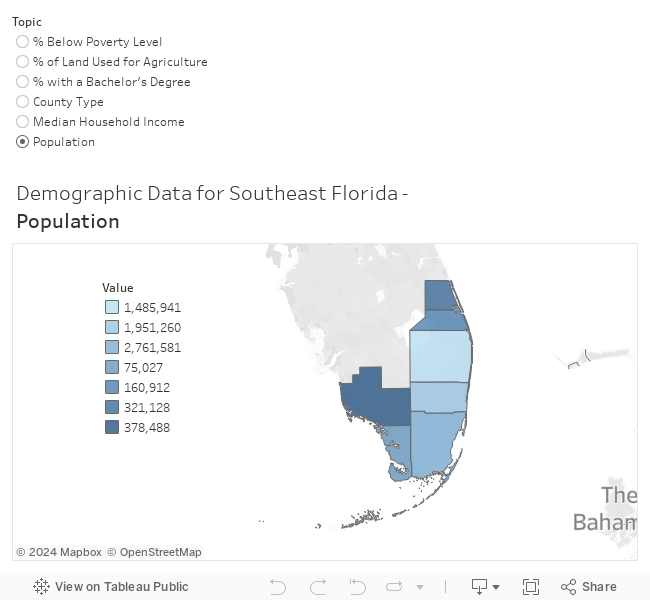
Given their coastal location, prominent industries and urbanization, Southeast Florida’s counties have faced the most obvious impacts of climate change such as sunny-day flooding and worsening sewage spills, and have worked the longest and spent the most to prepare. Key issues include threats to the built and natural environment including freshwaters, and socioeconomic vulnerabilities. Climate change trends across the region include sea rise, pollution and rising temperatures; Miami has endured record heat in the mid-90s this spring. With so many unique ecosystems from the Everglades to Keys coral reefs to the Indian River Lagoon, environmental instability is a considerable threat.
Residents’ quality of life is a major issue since climate change impacts key industries, can lead to health problems and disproportionately impacts disadvantaged communities. Prominent industries in the region include tourism, real estate and agriculture, all impacted by climate change. High temperatures shorten crop seasons and sea rise and pollution harm marine environments such as coral reef and beaches. Regionally, residents are vulnerable to heat and other weather extremes. Heat-related emergency department visits are on the rise, a significant concern considering the high elderly populations in many southeast counties. Climate change’s disproportionate impact on disadvantaged residents is another concern. Outdoor workers in agriculture and construction are exposed to increasingly high temperatures. Low-income residents face higher electricity bills and may not have air conditioning. In Miami-Dade County, minority communities are being displaced through climate gentrification, as their homes in higher elevations have become desirable due to flooding at the waterfront.
Infrastructure challenges are significant throughout the region, including the need to raise roads in Miami-Dade and Monroe counties—and the problem of how to decide which to raise first, as Scholar Taylor Paynter pointed out in the Keys report. The most positive trends in the region involve the counties’ cooperation and long-time work on climate resilience. Broward, Miami-Dade, Monroe and Palm Beach counties united to form the Southeast Florida Regional Climate Change Compact a decade ago. Most counties have climate resilience officers, climate action plans and vulnerability assessments.
Broward: Yes
Collier: No
Martin: No
Miami-Dade: Yes
Monroe: Yes
Palm Beach: Yes
St. Lucie: No
Broward: Yes
Collier: Yes
Martin: Yes
Miami-Dade: Yes
Monroe: Yes
Palm Beach: No
St. Lucie: Yes
Broward: Yes
Collier: Yes
Martin: Yes
Miami-Dade: Yes
Monroe: Yes
Palm Beach: Yes
St. Lucie: Yes
Broward: 206,065
Collier: 39,804
Martin: 22,930
Miami-Dade: 270,841
Monroe: 9,135
Palm Beach: 165,513
St. Lucie: 45,074
Broward: 78,741
Collier: 21,356
Martin: 12,426
Miami-Dade: 83,233
Monroe: 3,932
Palm Beach: 86,591
St. Lucie: 14,929
Broward: 623,958
Collier: 84,077
Martin: 14,932
Miami-Dade: 501,047
Monroe: 46,199
Palm Beach: 133,892
St. Lucie: 20,298
* For time series data, see the Data Explorer page
Average number of extreme heat days, 2016: 26.86Broward: 27
Collier: 30
Martin: 26
Miami-Dade: 27
Monroe: 28
Palm Beach: 25
St. Lucie: 25
Broward: 38
Collier: 30
Martin: 31
Miami-Dade: 37
Monroe: 8
Palm Beach: 28
St. Lucie: 42
Broward: 0
Collier: 0
Martin: 0
Miami-Dade: 0
Monroe: 0
Palm Beach:
St. Lucie: 0
* For time series data, see the Data Explorer page
Average number of emergency department visits for asthma, 2018: 45.00Broward: 59.36
Collier: 34.97
Martin: 33.42
Miami-Dade: 50.39
Monroe: 28.09
Palm Beach: 46.55
St. Lucie: 62.22
Broward: 82.18
Collier: 48.57
Martin: 65.60
Miami-Dade: 52.70
Monroe: 43.95
Palm Beach: 48.28
St. Lucie: 109.61
Broward: 17.63
Collier: 20.33
Martin: 32.05
Miami-Dade: 10.34
Monroe: 25.69
Palm Beach: 20.22
St. Lucie: 36.31