“The county must realize that the projections of sea-level rise show that ‘it will not be possible, or practical, to save everything’,”
–Scholar Lacey Lingelbach, Pinellas County
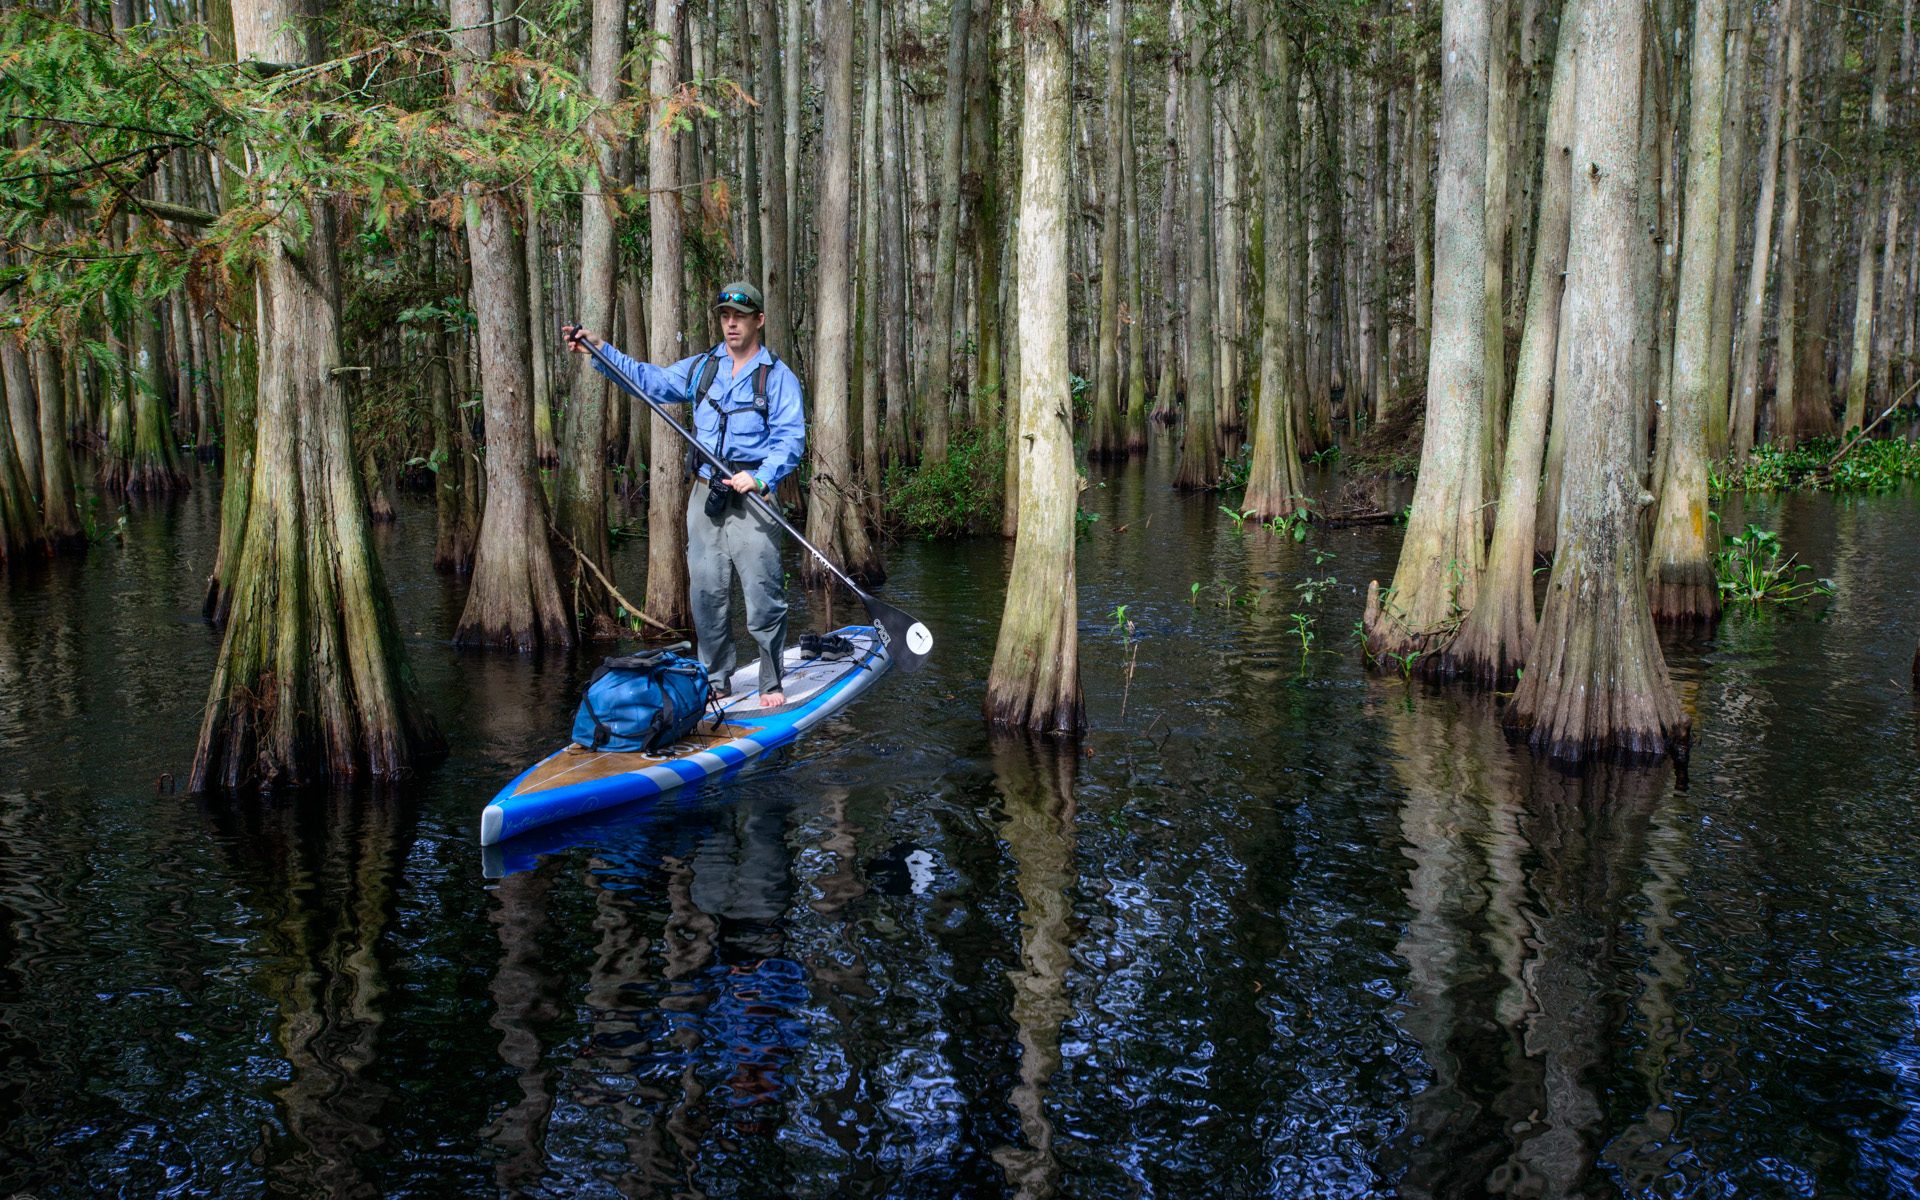
The West Central region ranges from urban counties that attract tourists to iconic Gulf beaches, to rural interior counties that are part of Florida’s agricultural heartland. While sea rise is among the major issues facing the coastal counties, all these counties have seen intense flooding, major storms swept in from the Gulf of Mexico, and more extreme heat.
The coastal counties have the will and the resources to hire resilience officers, carry out vulnerability assessments and create agencies within local governments dedicated to climate change and sustainability. Pinellas County is using a high-resolution storm surge models to rank risks to infrastructure and develop adaptation plans for its assets. Hillsborough County is drafting a resilience plan that will address concerns such as the fact that Tampa General Hospital, located on an island, could become inaccessible during a severe flooding event. Manatee County officials are pondering what will happen if islands such as Anna Maria become uninhabitable; would places now home to blue-collar workers, such as Oneco then gentrify, one displaced population displacing another? Within Sarasota County, the city of Sarasota has emerged as a climate leader even within a less-robust framework in larger North Port and more-rural reaches of the county. Many leaders see regional cooperation as crucial; the Tampa Bay Regional Resilience Coalition was modeled on south-east Florida’s 10-year-old climate compact.
The more rural counties face a different set of challenges, and often the response to climate change is minimal. Droughts, rising temperatures, severe storms, and soil challenges all threaten agriculture in these areas, thus economic livelihood. “If you ask any Glades County local they’d probably not focus on the term climate change,” wrote Scholar Jennifer Ronderos. “If you talk to them about flooding and drought, you have their attention.” These counties rarely have the dedicated resources, staff, or public will to raise awareness or combat “climate change.” The words generally don’t appear in these counties’ comprehensive land use plans, even though they would be well-served to prepare for in-migration from the coasts.
Glades’ is among the plans that promote reduced greenhouse gas emissions and energy conservation. In some cases, the words may be different, but the efforts are still crucial for a more-sustainable future.
Charlotte: No
Desoto: No
Glades: No
Hardee: No
Hendry: No
Highlands: No
Hillsborough: No
Lee: Yes
Manatee: No
Pinellas: Yes
Sarasota: Yes
Charlotte: No
Desoto: No
Glades: No
Hardee: No
Hendry: No
Highlands: No
Hillsborough: No
Lee: Yes
Manatee: Yes
Pinellas: Yes
Sarasota: Yes
Charlotte: Yes
Desoto: Yes
Glades: Yes
Hardee: Yes
Hendry: Yes
Highlands: Yes
Hillsborough: Yes
Lee: Yes
Manatee: Yes
Pinellas: Yes
Sarasota: Yes
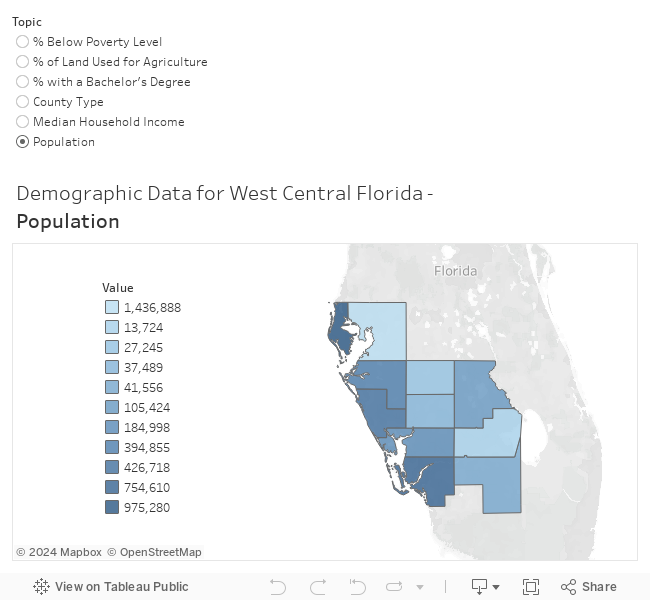
Charlotte: 34,538
Desoto: 4,893
Glades: 2,788
Hardee: 2,701
Hendry: 5,292
Highlands: 17,987
Hillsborough: 152,140
Lee: 94,508
Manatee: 48,927
Pinellas: 139,460
Sarasota: 62,153
Charlotte: 13,747
Desoto: 1,490
Glades: 698
Hardee: 825
Hendry: 1,200
Highlands: 7,278
Hillsborough: 43,769
Lee: 37,015
Manatee: 20,439
Pinellas: 67,858
Sarasota: 34,516
Charlotte: 52,979
Desoto: 1,108
Glades: 3,258
Hardee: 486
Hendry: 4,538
Highlands: 2,700
Hillsborough: 96,497
Lee: 169,146
Manatee: 43,673
Pinellas: 159,355
Sarasota: 58,182
Average number of extreme heat days, 2016: 21.36
Charlotte: 24
Desoto: 10
Glades: 13
Hardee: 12
Hendry: 14
Highlands: 14
Hillsborough: 24
Lee: 27
Manatee: 28
Pinellas: 44
Sarasota: 25
Charlotte: 53
Desoto: 46
Glades: 54
Hardee: 45
Hendry: 51
Highlands: 40
Hillsborough: 34
Lee: 37
Manatee: 36
Pinellas: 29
Sarasota: 31
Charlotte: 0
Desoto: 0
Glades: 0
Hardee: 0
Hendry: 0
Highlands: 0
Hillsborough: 0
Lee: 0
Manatee: 0
Pinellas: 0
Sarasota: 0
Average number of emergency department visits for asthma, 2018: 47.83
Charlotte: 44.18
Desoto: 52.44
Glades: 25.68
Hardee: 44.77
Hendry: 59.12
Highlands: 69.11
Hillsborough: 57.71
Lee: 43.08
Manatee: 45.01
Pinellas: 52.60
Sarasota: 32.42
Charlotte: 79.4
Desoto: 118.6
Glades: 49.7
Hardee: 181.1
Hendry: 111.8
Highlands: 126.6
Hillsborough: 72.2
Lee: 52.4
Manatee: 62.7
Pinellas: 86.9
Sarasota: 50.2
Charlotte: 77.07
Desoto: 51.01
Glades: 4.19
Hardee: 57.72
Hendry: 67.42
Highlands: 64.00
Hillsborough: 29.42
Lee: 27.78
Manatee: 50.86
Pinellas: 28.68
Sarasota: 31.67